Multi-stream live logs — fleet view, filters, limits
Single-firewall live logs are useful when you’re debugging one engine. The multi-stream view is what you actually live in once you have more than one firewall under management — every engine’s traffic, merged into one timeline, filtered by whatever dimension you care about right now.
Opening the fleet stream
Section titled “Opening the fleet stream”- Sidebar → Live logs (the top-level entry, not the per-firewall tab).
- By default the stream subscribes to every firewall in the tenant. The firewall picker in the toolbar lets you scope to a subset — multi-select, no limit.
- Pause / resume with the toolbar button or
Space. Pause buffers up to 5,000 events in the browser; once the buffer fills, oldest events drop.
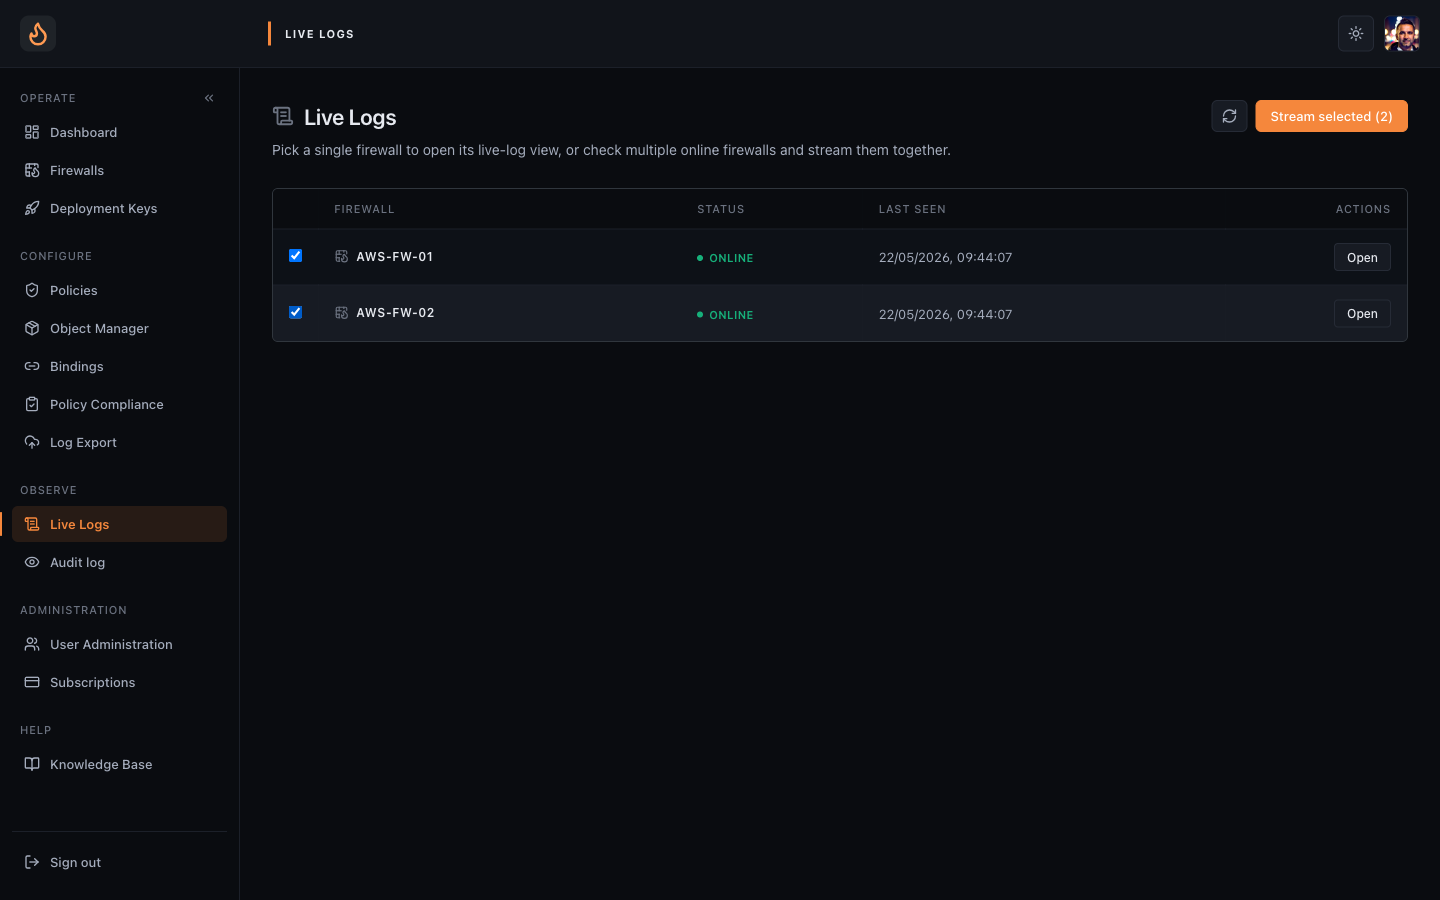 Pick one or more online firewalls — the Stream button activates once at least one is checked.
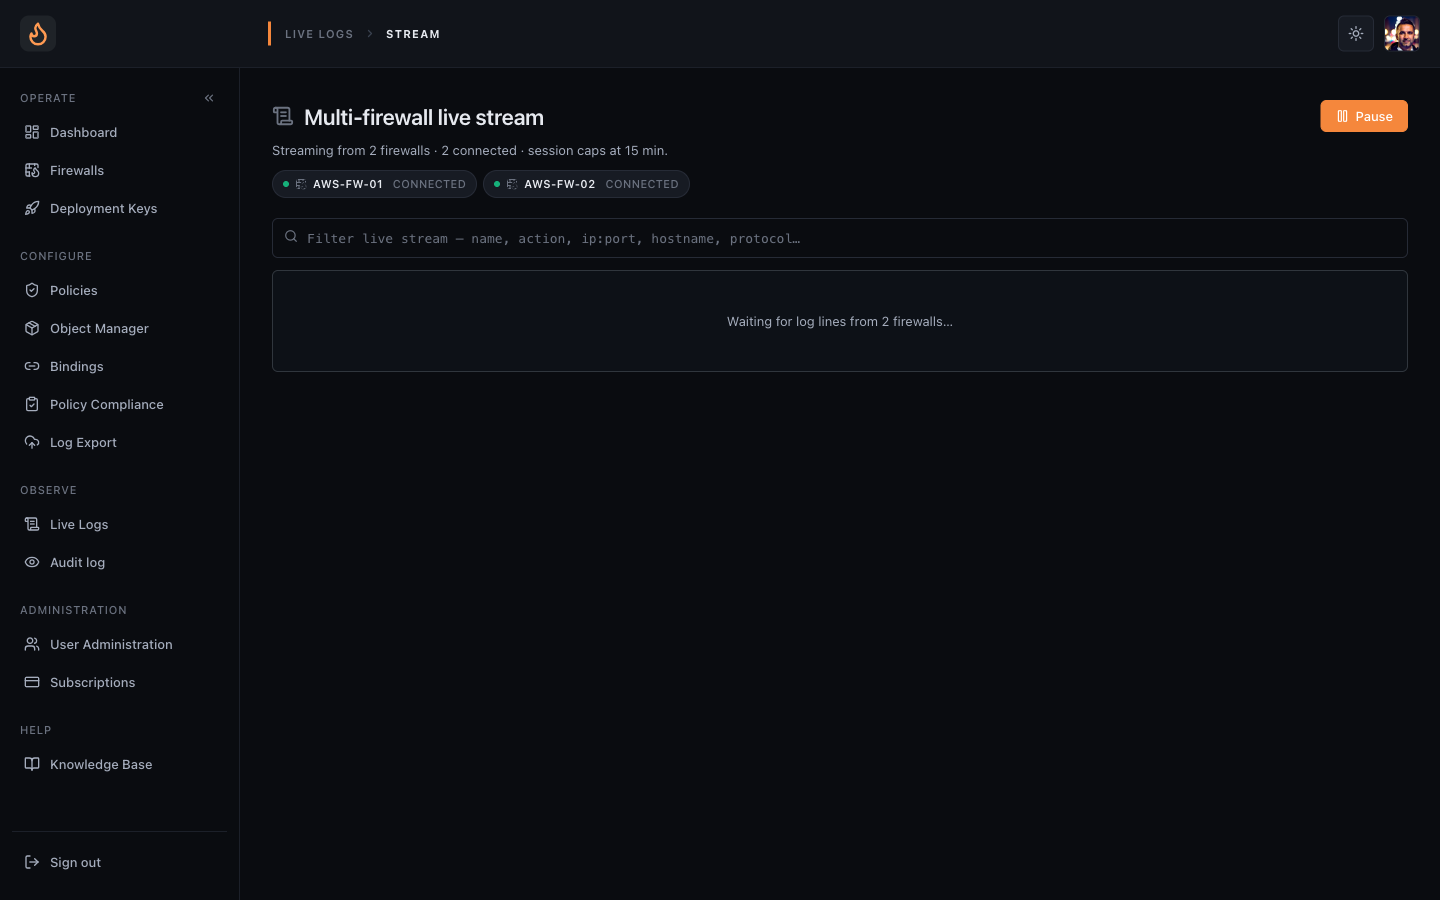 Merged stream — every row tagged with its source firewall, interleaved by engine timestamp.
How the merge works
Section titled “How the merge works”Each engine streams its own events to ws-handler over its WebSocket. The
console subscribes to one fan-out stream that interleaves frames from every
engine the tenant owns, ordered by engine-side timestamp. Cloud-side enrichment
(country, ASN, SNI for TLS) is applied on the way through before frames hit the
browser.
Each row in the table is tagged with a firewall badge — a coloured chip with the firewall name — so you can tell at a glance which engine emitted any given event without losing the merged chronology.
Filters
Section titled “Filters”The toolbar holds a query bar that supports the same expression language as history search. The most common filters:
firewall:name — limit to one or more firewalls (chips also do this via the picker).action:``drop/accept— usually you want drops.src.country:cc — two-letter country code from the cloud-side GeoIP lookup.dst.port:n — single port or range like1000-2000.src.ip:cidr — full CIDR match, supports /32 for a single host.sni:host — TLS server name, supports glob (*.amazonaws.com).
Filters compose with implicit AND. Switching filters does not re-subscribe — it just changes what the browser renders, so the stream keeps flowing underneath.
Practical limits
Section titled “Practical limits”- Per-engine event rate. The engine can emit tens of thousands of events/second under load, but the cloud relay caps live-stream emission at ~2,000 events/second/engine. Above that the engine still writes locally and to sinks; only the live stream sheds.
- Fleet aggregate. The console renders comfortably up to ~10,000
events/second across all merged engines. Apply filters early — a
action:dropfilter alone usually cuts volume by 95%. - Tab focus. Background tabs throttle the renderer to 1 frame/second to avoid CPU burn. Bring the tab to the foreground if you need real-time fidelity.
From live to history
Section titled “From live to history”Spot something interesting in the live stream and want to dig deeper? Click the row’s Find similar action. The console hands the row’s salient fields (src/dst, port, action, firewall) to the history search page as a pre-filled query and opens the last 15 minutes by default. Widen the time range from there.
What’s not in the live stream
Section titled “What’s not in the live stream”- Compliance findings, audit events, deploy events — those live on the Audit page, not the live log.
- Sink delivery telemetry — per-sink health chips on the firewall row are the surface for that.
- Engine internal state — heartbeat, version, queue depth. Surfaced on the Firewalls page, not interleaved with packet events.
If the stream stops
Section titled “If the stream stops”Most “live logs went dark” reports trace back to one of:
- The engine’s WebSocket has gone stale post-upgrade. Workaround:
systemctl restart enforza-engineon the affected firewall. - The browser tab has been backgrounded longer than the WS idle timeout. Refresh the page to re-subscribe.
- You’ve filtered so aggressively that no events match. Strip filters and confirm before troubleshooting further.