Watch live logs (single firewall and fleet)
Every accept / drop / flow-close on every bound engine emits a structured JSON event the engine streams to the cloud over WebSocket. The cloud fans events out to any browser watching the firewall. No data leaves the engine VM unless a viewer is open — log streaming is on-demand to keep network and Lambda costs bounded.
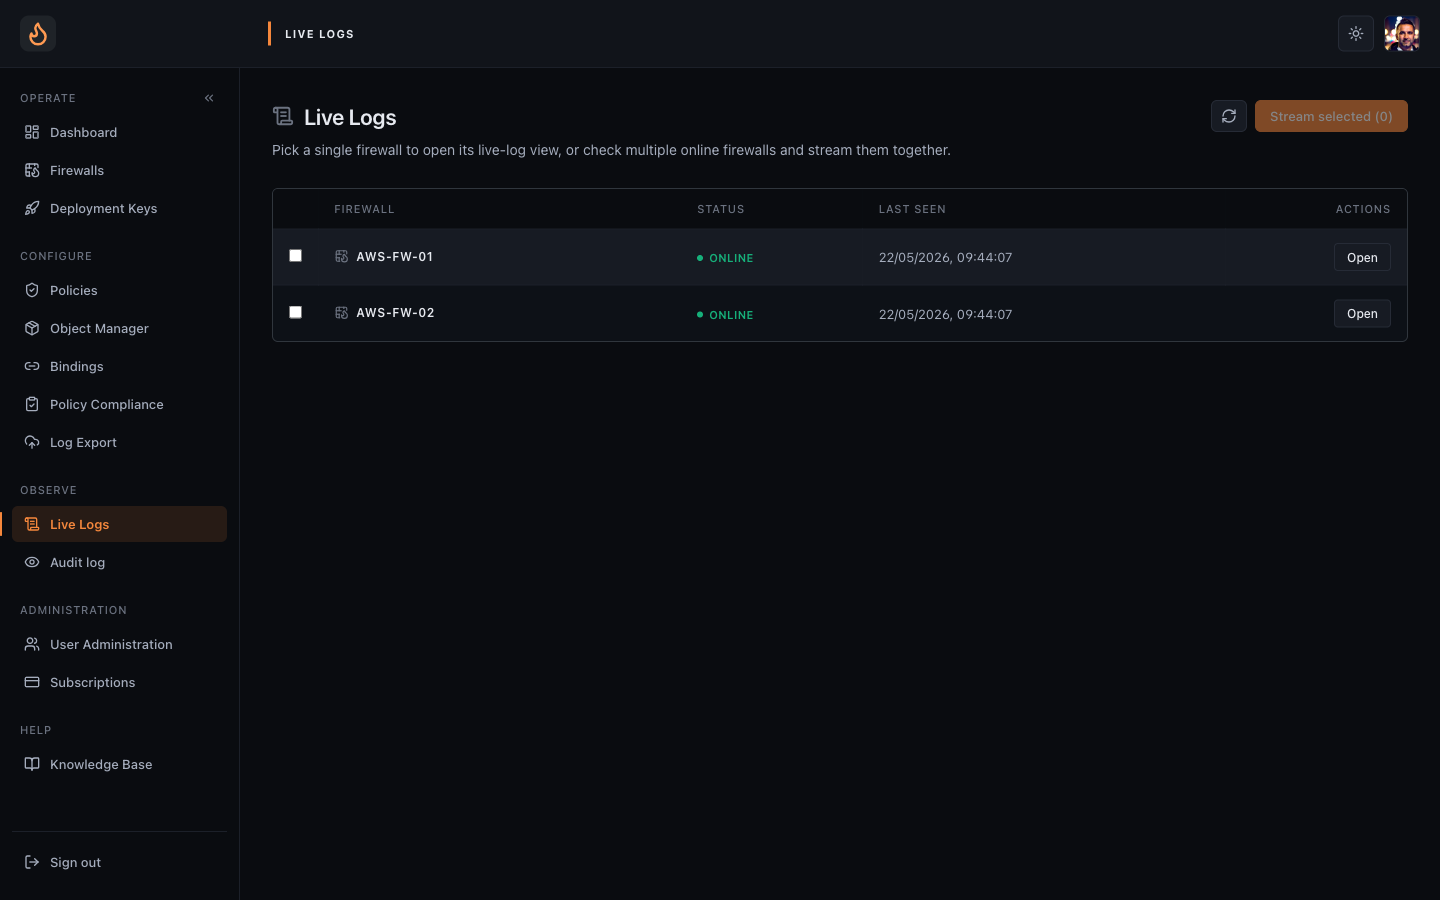 Live Logs entry — pick one firewall or check several for a merged fleet stream.
Watching a single firewall
Section titled “Watching a single firewall”- Firewalls → click the firewall → Live logs tab.
- Events appear top-down as they happen; the most recent stays at the top. Buffer caps at 1,000 rows.
- Pause the stream to investigate; new events queue but don’t redraw. Resume empties the queue.
- Clear wipes the on-screen buffer (engine keeps writing on disk).
- Filter matches across IP, port, hostname, rule name, country, ASN, ASN org. Try the country code from the flag emoji to slice by region.
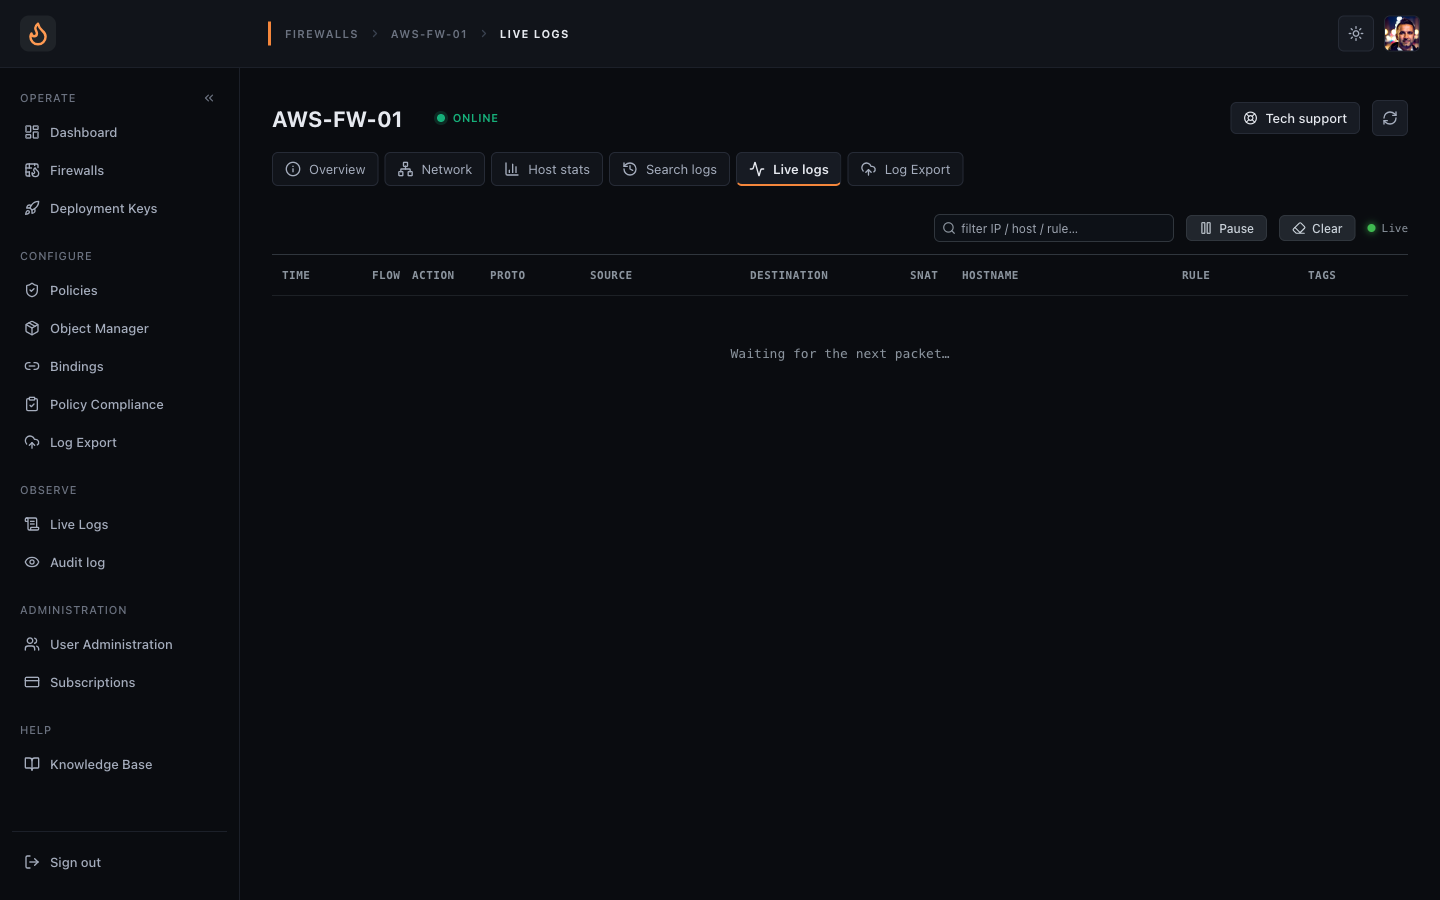 Single-firewall live stream — newest rows at the top, Pause/Clear in the toolbar.
Reading a row
Section titled “Reading a row”- Time — engine clock, UTC.
- Flow icon — to-firewall / through-firewall / from-firewall section indicator.
- Action — accept (green) / drop (red).
- Protocol/port — e.g.
TCP/443. - Source / Destination — IPs. Public IPs are annotated with the country flag (MaxMind GeoLite2); hover for the ASN organisation.
- SNAT column — green if the engine source-translated this flow.
- Hostname — TLS SNI / HTTP Host the engine extracted (URL rules only — no DNS lookups happen).
- Rule — the comment from the rule that matched.
Click any row for a slide-over with the full JSON entry, grouped by Event / Network / GeoIP / Packet / TLS / Flow / Engine.
Watching the whole fleet at once
Section titled “Watching the whole fleet at once”For multi-firewall views — useful for “is anyone seeing X right now”:
- Sidebar → Live Logs.
- Pick one or more firewalls (or all). The merged stream tags every row with the firewall name so you can see at a glance which engine emitted it.
- Same filter behaviour, same detail panel.
- The 15-minute session cap is per browser tab, not per firewall — the merged view still caps at 15 minutes total.
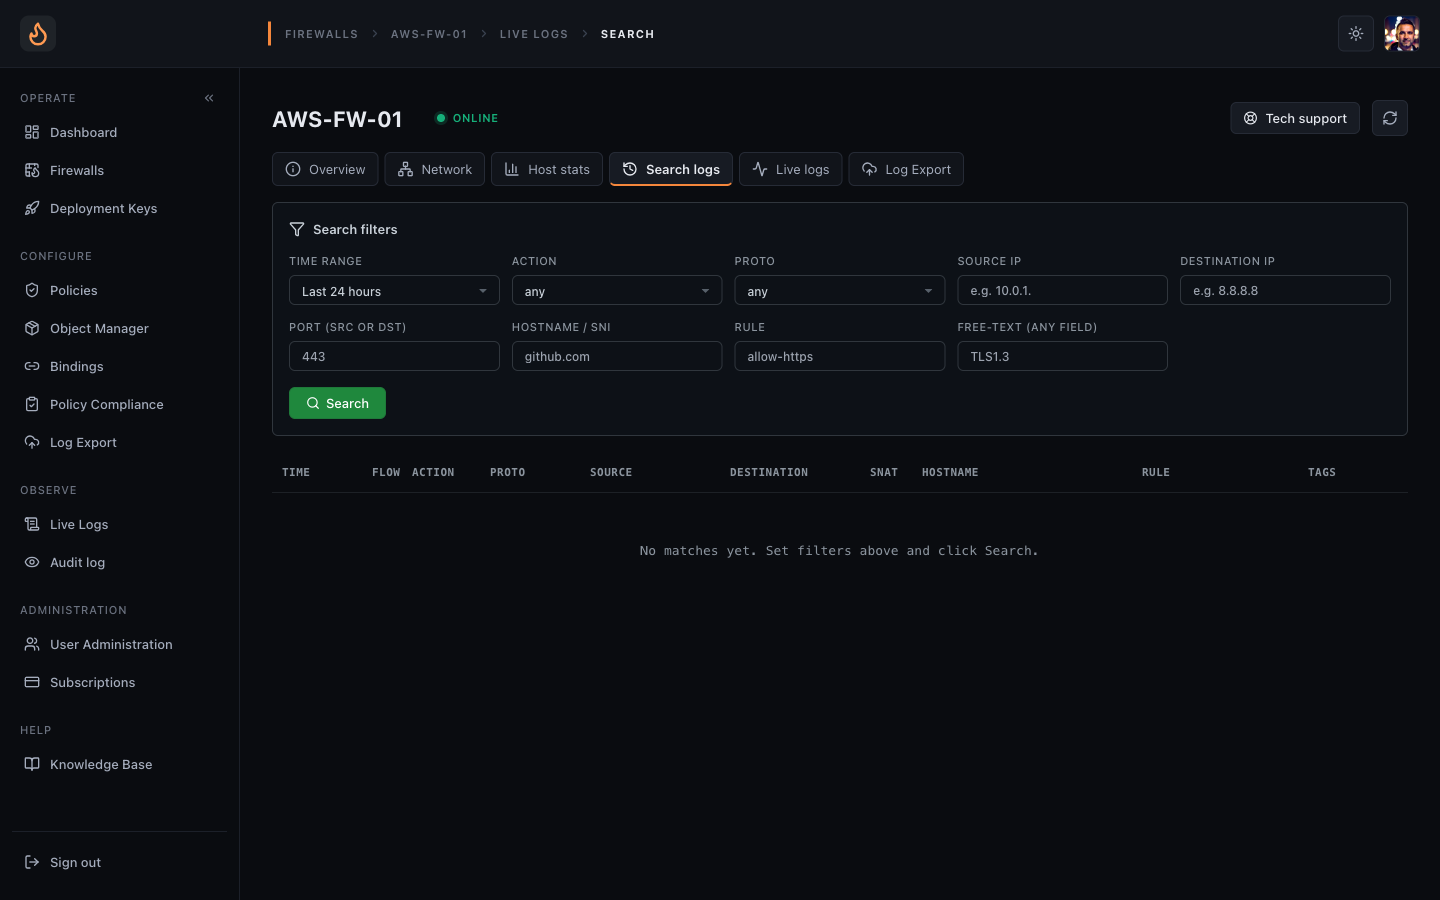 Search logs — time range + filters, query runs on the engine against its on-disk shards.
Searching historical logs
Section titled “Searching historical logs”Live logs only show new events. For “show me every drop on this firewall last Tuesday between 09:00 and 11:00”:
- Firewall → Search logs tab.
- Pick a time range and any filters (action, protocol, src/dst IP, port, rule, hostname, free-text substring).
- The query runs on the engine itself against its on-disk shards. No data leaves the engine to cloud storage by default.
- Results stream into the same table renderer; click any row for the detail panel.
Troubleshooting
Section titled “Troubleshooting”- “Engine offline” banner instead of the stream — engine isn’t connected to the cloud. Check the Firewalls page status.
- Stream connects but no rows appear — engine is live but has no traffic. Generate some from a host behind it (curl, ssh attempts) and they’ll show up within ~1 s.
- Country flag missing on a public IP — MaxMind has no answer for that prefix (newly-allocated or anycast). The IP still appears, just without the flag annotation.
- No flag on RFC1918 / link-local addresses — expected. Private IPs don’t belong to a country.